Here are the main paper citations (in BibTeX format):
@string{prosfg= "Proteins: Structure, Function, and Genetics"}
@string{prosfb= "Proteins: Structure, Function, and Bioinformatics"}
@string{jmb="Journal of Molecular Biology"}
@string{bioinf="Bioinformatics"}

@article{SAMT98,
	author="Kevin Karplus and Christian Barrett and Richard Hughey",
	title="Hidden {Markov} Models for detecting Remote Protein Homologies",
	journal=bioinf,
	year="1998",
	volume=14, number=10,
	pages="846-856",
	annotate="This paper provides a fairly detailed presentation
	of the SAM-T98 method for finding remote homologs, including
	both the method and the results on FSSP, SCOP, and PIR test sets."
}

@article{SAMT2K-CASP4-proteins,
	author="Kevin Karplus and Rachel Karchin and
		Christian Barrett and Spencer Tu and Melissa Cline and
		Mark Diekhans and Leslie Grate and Jonathan Casper and
		Richard Hughey",
	title="What is the value added by human intervention
		in protein structure prediction?",
	journal=prosfg,
	year=2001,
	volume=45,
	number="S5",
	pages="86--91"
}

@article{SAMT02-CASP5,
	author="Kevin Karplus and
		Rachel Karchin and
		Jenny Draper and
		Jonathan Casper and
		Yael Mandel-Gutfreund and
		Mark Diekhans and
		Richard Hughey",
	title="Combining local-structure, fold-recognition, and new-fold
		methods for protein structure prediction",
	journal=prosfg,
	year="2003", month="15~"#oct,
	volume="53",
	number="Suppl.~6",
	pages="491-496"
	}

@article{SAMT04-CASP6,
    author="Kevin Karplus and Sol Katzman and George Shackleford and
    Martina Koeva and Jenny Draper and Bret Barnes and Marcia Soriano
    and Richard Hughey",
    title="{SAM-T04}: what's new in protein-structure prediction for {CASP6}",
    journal=prosfb,
    year=2005,
    volume="61",
    number="S7",
    pages="135-142"
}
The output page is printed as tests are completed, so you are viewing an incomplete page. The page always appears complete, even though more data is still being appended to the file. You will need to hit the RELOAD button on your browser to refresh the file. Keep in mind that it can take several minutes for all the tests to complete (longer if the server is exceptionally busy).
A complete file will have "this page has finished loading" written at the end. If you have waited a long time, check for such a line. If that line is not present, then either your query is still not complete (the server may be under high load) or something has crashed. The recommended solution is to simply wait longer, or, after a very long time, to resubmit the query. You may also manually inspect the error logs (delete "summary.html" from the URL in order to get a list of files in your query directory—see the question below for more information on this procedure).
There are several possible causes. To find out more, go up one level in the URL (that is, delete the "summary.html" text from your browser's address bar, and load that directory). This gives you the full directory of result files, including the error messages. Sometimes you will be able to easily diagnose the problem from the error messages in the error logs.
The most common problem is having a sequence with a lower-case sequence. We currently detect and capitalize an entirely-lower-case sequence, but if there is even one upper-case letter in the sequence, then your sequence will be shorter than expected. SAM-T06 uses a script that assumes that lowercase characters are insertions (not to be included in the HMM). The solution to this problem is convert your sequence to all upper-case and resubmit.
There are a lot of outputs from our SAM-T06 web server, and we haven't had time to write an interpretation guide for all of them.
The ones to concentrate on are:
- multiple alignment
- What homologs are there for the target? What organisms are they from? What annotation exists for homologs? Do any of the homologs have experimental structures in PDB? The pretty html format provides long names and links to other databases.
- Sequence Logos
- The logos give a quick graphical view of what the target
hidden Markov models were looking for. The first logo
is based on the amino acids of the multiple alignment.
The height of each bar shows the conservation at that
position in the alignment (expressed as a relative
entropy in bits).
The secondary structure logos show how confident the prediction is for each position. The height is the information gain (the relative entropy of the predicted probabilities and the background probabilities). Where the confidence is high, the predictions tend to be much more accurate. We have found the structure logos to be the most informative way to view the predictions. - Top Hits
- What are the most likely templates and how good are they? We express the goodness of fit as a E-value (see below for an explanation).
- Top Models
- What are our most-favored alignments to the templates? We have generated many alignments for each target-template pair, and report in this table the ones that seem most likely, based on the alignment scores and our alignment tests of different alignment methods. You can get more alignments by going up one level in the URL (dropping the "summary.html") to get to the directory of all the results, then going to the subdirectory for the template you are interested in. The a2m files in that directory are other alignments.
- PDB files
- We don't currently provide a 3D model to look at for
sequences submitted by a web user user, but we do provide some for
pre-computed web pages. These models are created from the top
alignment (or alignments) by doing sidechain substitution on
the template. There is no optimization done, no loop
modeling, no gap closing, so these should
really only be considered as crude backbone models, not full
3D models.
There may be multiple models in a single PDB file, corresponding to different alignments or different templates. Usually the first model is the one most likely to be right.
Don't blindly trust these 3D models—at the very least look at the E-value for the template in the best-scores files. If the E-value is poor (greater than 1.0e-02, for example), then the model should be regarded as speculative.
For sequences submitted to the web server, or for alignments other than the ones we provide models for, can create a crude model from an alignment using the server at http://predictioncenter.llnl.gov/local/al2ts/al2ts.html (For more details, see below.)
The E-value is an estimate of approximately how many sequences would score this well by chance in the database searched. For SAM-T06, E-values less than about 1.0E-5 are very good hits and are very likely to have a domain of the same fold as the target. E-values larger than about 0.1 are very speculative—if your best hit is in this range then the correct fold is likely to be one of the top ten or twenty hits (unless the target is a new fold), but it is difficult to tell which of the top hits is the right one.
Between 1.0E-5 and 0.1 the goodness of the match will vary somewhat from target to target, but will often be a good match.
When you get an extremely small E-value (say 1.e-10 or smaller), then the alignments you get from SAM-T06 may not be any better than alignments that you get from sequence-sequence aligners like Smith-Waterman, FASTA, or BLAST. SAM-T06 is designed to to do good fold recognition and alignment in the difficult cases, and it may give up some performance on the "easy" ones.
We report predictions for several alphabets, most of which were developed at University of California, Santa Cruz. Most of the alphabets predict structural information about the protein, but we also predict residue burial. Currently the SAM-T08 server generates predictions for twelve structural alphabets (str2, alpha, bys, pb, o_sep, n_sep, o_notor, n_notor, o_notor2, n_notor2, str4, and dssp_ehl2) and three burial alphabets (CB_burial_14_7, near-backbone-11, and CB8-sep9).
The DSSP alphabet is defined by the DSSP program program (except we combine the rare Pi-helix letter "I" in the alphabet with helices "H"). The STRIDE alphabet is defined by the STRIDE program [Frishman D, Argos P. Knowledge-based protein secondary structure assignment. Proteins. 1995 Dec;23(4):566-79.] (again, we combine I with H).
The original DSSP alphabet uses the letters "H" (alpha helix), "B" (isolated beta-bridge), "E" (extended strand in beta ladder), "G" (3/10 helix), "I" (pi helix), "T" (H-bonded turn) and "S" (bend).
The str2 alphabet is an enhanced version of DSSP. The concept was
originated by post-doc Yael Mandel-Gutfreund. We have found that
two-track hidden Markov models built with an str2 secondary track are
particularly good at fold recognition and target-template alignments.
The alphabet's strength comes from the subdivision of DSSP letter "E"
into 7 letters, according to properties of a residue's relationship to
its strand partners.
In the diagram, dots indicate the strand of the residue being assigned. In a beta sheet, this strand is either surrounded by two parallel partners "P" , two anti-parallel partners "A" or one anti-parallel and one parallel partner "M". Edge strands (that have only one strand partner) have either a parallel partner "Q" or two anti-parallel partners: "Y" for the edge amino acid in the strand involved in a hydrogen bond or "Z" for the edge amino acid in the strand not involved in a hydrogen bond. Finally we retain the "E" label for amino acids which DSSP assigns no partners (generally beta bulges).
Another alphabet we use is ALPHA, which is the torsion angle of the carbon alpha atoms along the backbone. The torsion angle is measured by the C_alpha(i-1), C_alpha(i), C_alpha(i+1), C_alpha(i+2) atoms. We have divided the range up into 11 classes (not mnemonically named):
| alpha alphabet | |
|---|---|
| name | range |
| A | 165<=alpha<-170 |
| B | -136<=alpha<-103 |
| C | -103<=alpha<-68 |
| D | -68<=alpha<-17 |
| E | -170<=alpha<-136 |
| F | -17<=alpha<8 |
| G | 8<=alpha<31 |
| H | 31<=alpha<58 |
| I | 58<=alpha<85 |
| S | 85<=alpha<140 |
| T | 140<=alpha<165 |
The DSSP_EHL alphabet is used in CASP and
EVA
evaluations of secondary-structure prediction.
It combines all helix types (G, H, I) into one class (H), and both
beta bridges and beta strands into one class (E), with
everything else in an "other" class (variously called either C
or L).
Currently, we do not predict DSSP_EHL directly but combine our
predictions for the more detailed alphabets to get a DSSP_EHL
prediction. (We have not yet done extensive tests to see if
this is better or worse than predicting DSSP_EHL directly.)
The bys alphabet classifies based on a partitioning of the phi and psi torsion angles in Ramachandran space. [Christopher Bystroff, Vesteinn Thorsson, and David Baker, "HMMSTER: a hidden Markov model for local sequence-structure correlations in proteins", Journal of Molecular Biology, 2000 August 4;301(1):173-90.] The figure to the right (taken from Bystroff et al. 2000) shows the regions and the classifications used in the paper. We have modified the classifications slightly for our own use which are in the following table:
| bys alphabet | |||
|---|---|---|---|
| name | Bystroff | structure | |
| H | H | alpha R (alpha helix) | |
| E | E | beta S (beta strand) | |
| P | B | beta S (beta strand | |
| G | G | delta R (3-10 helix) | |
| Y | e | epsilon' | |
| N | b | gamma' | |
| L | L | alpha L (left handed helix) | |
| T | l | delta L | |
| D | d | zeta | |
| S | x | epsilon | |
| C | cis peptide |
The pb alphabet classifies amino acids using the phi and psi torsion angles of deBrevern's protein blocks. [A.G. deBrevern, C. Etchebest, S. Hazout, "Bayesian probabilistic approach for predicting backbone structure in terms of protein blocks", Proteins: Structure, Function, and Genetics, 2000 Sep 8;41(3):271-287.] The protein blocks use eight consecutive phi and psi torsion angles centered at the amino acid of interest (psi(i-2), phi(i-1), psi(i-1), phi(i), psi(i), phi(i+1), psi(i+1), phi(i+2)). The image to the right (taken from deBrevern et al. 2000) shows sixteen structures that were picked to be representative of all the blocks obtained from real structures. These sixteen blocks represent a letter in the alphabet and are defined in the table:
| pb alphabet | |
|---|---|
| name | structure |
| A | N-cap beta strand |
| B | N-cap beta strand |
| C | N-cap beta strand |
| D | beta strand |
| E | C-cap beta strand |
| F | C-cap beta strand |
| G | primarily coil |
| H | primarily coil |
| I | primarily coil |
| J | primarily coil |
| K | N-cap alpha helix |
| L | N-cap alpha helix |
| M | alpha helix |
| N | C-cap alpha helix |
| O | C-cap alpha helix |
| P | C-cap alpha helix to N-cap beta strand |
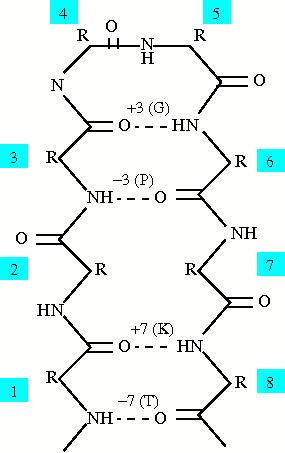
The sep alphabets are based on hydrogen bond patterns within the protein, and because there are two amino acids involved in hydrogen bonds, there are two sep alphabets: o_sep (based on the oxygen or the hydrogen acceptor in the bond) and n_sep (based on the nitrogen or the hydrogen donor in the bond). The oxygen and nitrogen are used because most solved structures do not have the resolution to see the actual hydrogens within the protein involved in hydrogen bonds. The alphabets were created to look at short range hydrogen bonds within the protein, from three to ten amino acids away along the backbone. The figure to the right shows a hairpin between beta strands and the classification for certain residues in the hairpin. The separation between residues is always calculated as (donor - acceptor) in order to create consisitancy with the alphabets. The amino acid labeled as 6 has a hydrogen bond with amino acid 3 so the separation is 3 and the amino acid is labeled as "G". Therefore amino acid 3 has a separation of -3 and is labeled as "P". There are also labels for no hydrogen bond, multiple hydrogen bonds, and a hydrogen bond to a backbone atom. The following table shows all the labels for both the sep alphabets:
| o_sep and n_sep alphabets | |
|---|---|
| name | structure |
| G | Separation +3 |
| H | Separation +4 |
| I | Separation +5 |
| J | Separation +6 |
| K | Separation +7 |
| L | Separation +8 |
| M | Separation +9 |
| N | Separation +10 |
| P | Separation -3 |
| Q | Separation -4 |
| R | Separation -5 |
| S | Separation -6 |
| T | Separation -7 |
| U | Separation -8 |
| V | Separation -9 |
| W | Separation -10 |
| A | Other separation |
| B | Multiple hydrogen bonds |
| C | Sidechain hydrogen bond |
| D | No hydrogen bond |
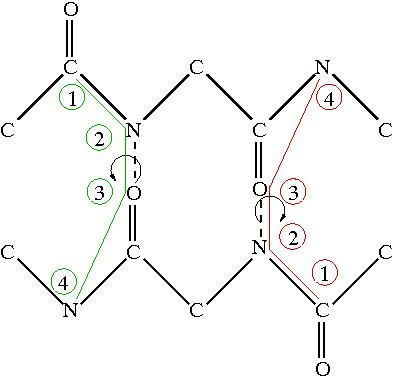
The notor alphabets also look at hydrogen bond properities, but instead of the separation along the backbone, they look at the torsion angle between the peptide planes. The figure to the right shows two examples of the torsion angles and which atoms are involved in measuring the notor angle. Like the sep alphabes, there are two alphabets based on the oxygen or the nitrogen in the hydrogen bond. The torsion angles are indicative of what structure the amino acid is in. The following table shows the labelling for the notor alphabets:
| o_notor and n_notor alphabets | |
|---|---|
| name | structure |
| G | Separation +3 (3-10 helix) |
| H | Separation +4 (alpha helix) |
| P | notor angle < -133 or > 76 (parallel) |
| B | -133 <= notor angle < -17 (anti-parallel) |
| A | -17 < notor angle <= 76 (anti-parallel) |
| S | Sidechain hydrogen bond |
| M | Multiple hydrogen bonds |
| N | No hydrogen bond |
The notor2 alphabets take the notor alphabets and the sep alphabets and combine them somewhat. Some of the common separations and multiple hydrogen bonds are separated out into their own class. The notor2 alphabets also have one based on the oxygen and one on the nitrogen, and the following table shows the classifications:
| o_notor2 and n_notor2 alphabets | |
|---|---|
| name | structure |
| G | Separation +3 (3-10 helix) |
| H | Separation +4 (alpha helix) |
| I | Separation +5 |
| P | notor angle < -133 or > 76 (parallel) |
| B | -133 <= notor angle < -17 (anti-parallel) |
| A | -17 < notor angle <= 76 (anti-parallel) |
| S | Sidechain hydrogen bond |
| F | Multiple separation +3 and +4 |
| J | Multiple separation +4 and +5 |
| M | Other multiple hydrogen bonds |
| N | No hydrogen bond |
The str4 alphabet is a combination of several different alphabets, and unlike str2 it is not based on the DSSP program. It uses ideas from str2, notor2, and alpha alphabets in order to combine aspects from different alphabets together. The classifications are similiar to str2 in that they separate out the strand types (as parallel, anti-parallel, and mixed) and their location (edge or middle). The parallel strands are split into the high and low torsion angles as the NOtor2 alphabet does. There are also classifications for multiple hydrogen bonds from NOtor2 and for other bifurcated bonds. The coil regions are taken as ranges of the alpha torsion angles. The following are the classifications for the str4 alphabet:
| str4 alphabet | |
|---|---|
| name | structure |
| F | Separation +3 and +4 bonds |
| G | Separation +3 (3-10 helix) |
| H | Separation +4 (alpha helix) |
| I | Separation +5 |
| J | Separation +4 and +5 bonds |
| A | Anti-parallel middle high NOtor angle |
| B | Anti-parallel middle low NOtor angle |
| C | Anti-parallel edge high NOtor angle |
| D | Anti-parallel edge low NOtor angle |
| E | Anti-parallel edge unbonded |
| K | Mixed anti-parallel high NOtor angle |
| L | Mixed anti-parallel low NOtor angle |
| M | Mixed parallel |
| P | Parallel middle |
| Q | Parallel edge bonded |
| R | Parallel edge unbonded |
| S | -17 <= alpha angle < 85 |
| T | 85 <= alpha angle < 165 |
| U | alpha angle > 165 or <= -136 |
| V | -136 <= alpha < -17 |
| W | Multiple bifurcated bond |
Our burial predictions use various alphabets using letters A-G or A-K (for 7 or 11 levels of burial). In all the burial alphabets, A is the most exposed and burial gradually increases to G or K, which are fully buried. One alphabet we are currently using (CB_burial_14_7) counts the number of C-beta atoms in a sphere of radius 14 around the C-beta atom of the residue (excluding itself), as Rachel Karchin found this alphabet to have good conservation and predicatability. [Rachel Karchin and Melissa Cline and Kevin Karplus, "Evaluation of local structure alphabets based on residue burial", Proteins: Structure, Function, and Genetics, 2004 May 15;55(3):508-18.]
| CB_burial_14_7 alphabet | |
|---|---|
| name | range |
| A | count < 27 |
| B | 27 <= count < 34 |
| C | 34 <= count < 40 |
| D | 40 <= count < 47 |
| E | 47 <= count < 55 |
| F | 55 <= count < 66 |
| G | count >= 66 |
Another burial alphabet we have implemented is near-backbone-11, what we call a two-spot burial alphabet. This alphabet has been optimized to maximize the mutual information. The first spot is the spot where we place the sphere of radius 9.65 that will define the area that we count residues in. This spot is located near the sidechain of the amino acid. The second spot can be considered the count spot, and the alphabet is based on counting the number of count spots within the sphere of interest. The count spot is located near the nitrogen atom of the backbone, which is why the alphabet is called near-backbone. The eleven states of the alphabet are in the table:
| near-backbone-11 alphabet | |
|---|---|
| name | range |
| A | count < 4 |
| B | 4 <= count < 6 |
| C | 6 <= count < 7 |
| D | 7 <= count < 10 |
| E | 10 <= count < 13 |
| F | 13 <= count < 16 |
| G | 16 <= count < 20 |
| H | 20 <= count < 23 |
| I | 23 <= count < 26 |
| J | 26 <=count < 29 |
| K | count >= 29 |
The CB8-sep9 alphabet is a burial alphabet based on the the carbon beta atom of the residue. This alphabet is different though because it only counts the number of residues that have a separation greater than 9 along the backbone. Because of this, the bin sizes are quite different than other burial alphabets, with the largest bin being the first bin and the smallest being the last bin. The following table shows the classifications for the CB8-sep9 alphabet:
| CB8-sep9 alphabet | |
|---|---|
| name | range |
| A | count = 0 |
| B | count = 1 |
| C | count = 2 |
| D | count = 3 |
| E | count = 4 |
| F | count = 5 |
| G | count = 6 |
| H | count = 7 |
| I | count = 8 |
| J | count = 9 |
| K | count = 10 |
| L | count = 11 |
| M | count = 12 |
| N | count > 12 |
Other alphabets are being developed in the lab, and they are being tested for usefulness with protein structure prediction. More alphabets could be added to the web server and their definitions will be added here to the FAQ.
Currently, the SAM-T06 query page only accepts a single sequence in FASTA format. In FASTA format, a sequence must have a unique name identifying the sequence in addition to the sequence residues. The name starts with a > (greater-than) character at the beginning of the line and continues to the first white space on the line. The rest of the name line is a comment, which is ignored. The sequence itself starts on the next line following the name line. The FASTA file should have the sequence itself in uppercase, thoug all-lowercase sequences will be accepted. Evetually we'll accept a2m alignments as input, in which case upper and lowercase distinctions will matter.
The SAM-T06 query page returns multiple alignments in FASTA, pretty-printed, and HTML formats, and pairwise alignments of the target to the best-scoring template candidates in FASTA and .al (CASP) format. The FASTA format is really our a2m format, which the SAM tools understand but some conversion tools misinterpret. The SAM package includes the "prettyalign" program, which can be used to add extra dots to an alignment, making it easier for tools that don't understand the a2m format to convert to other programs.
The graphical results from SAM-T06 are the sequence logos, which are in EPS (Encapsulated Postscript) format and PDF (Portable Document Format), and the jpeg images of the incomplete model built from the first alignment and of the automatically built complete model.
If you wish to see interact with a model of the predicted protein, you have to download the pdb files. Currently these are kept in gzip format (to save space and transmission time). Some tools (such as rasmol) will handle gzipped pdb files directly, others will need to have the files uncompressed (with tools such as gunzip or Stiffit Expander).
Most of the sequence IDs in a SAM-T06 a2m file come from the IDs in the NR database. The sequence IDs may be modified by SAM to indicate the first and last sequence positions that matched the SAM-T06 HMM.
For example in the following sequence ID taken from a SAM-T06 alignment,
>gi|16080670|ref|NP_391498.1|_1:234 (NC_000964) similar to hypothetical
proteins [Bacillus subtilis] gi|7450240|pir||G70067 conserved hypothetical
protein ywqL - Bacillus subtilis gi|1894750|emb|CAB07450.1| (Z92952)
product similar to E.coli YjaF protein [Bacillus subtilis]
gi|2636142|emb|CAB15634.1| (Z99122) similar to hypothetical proteins
[Bacillus subtilis]
the original sequence name gi|16080670|ref|NP_391498.1|
has had _1:234
appended to indicate that the SAM-T06 HMM for the alignment matched
the sequence starting a sequence position 1 and ending at sequence
position 234.
This happens fairly often—the most common causes are composition bias and large helices (particularly coiled-coils). The programs FASTA, BLAST, and PSI-BLAST can all be fooled into reporting very strong scores for sequences whose only similarity is that they both have long amphipathic helices. SAM-T06's reverse-sequence-null model cancels this signal (as well as composition bias and length signals), resulting in a method with many fewer false positives. A few true positives are lost, but not too many.
As an example, the leucine zipper 1ce0A gets only 25 sequences in the 1ce0A.t02.a2m alignment. The 19 PDB sequences in the alignment are all homologs (at least, similar structure and somewhat similar sequence). Other methods are likely to get almost any coiled-coil as a strong hit. This is an example of the reverse-sequence-null model removing a lot of trash (and possibly some good stuff) due to helicity signals.
Another common problem is with the cysteine-rich metallothionein appearing in searches for proteins that had highly conserved cysteines—even ones with very different structure and function. SAM-T06 only includes metallothionein when almost all the cysteines line up.
Note: the compositional corrections to PsiBlast in August 2002 made the PsiBlast multiple alignments almost as good as the SAM-T02 alignments—the contamination by unrelated sequences was greatly reduced.
If your protein is a large, multi-domain protein, your best bet is to break it up into pieces (near domain boundaries is best, if you can guess where those are). Protein structure prediction generally works better on single domains in any case.
The SAM-T06 method builds models the size of the input sequence. Finding domain boundaries when no structure is known is an art that we have not attempted to automate (though other researchers have).
We have generally found it best to do a search first with the full-length protein, then remove any domains that are strongly predicted, and do the prediction again on what is left. A weaker prediction for a second domain may be masked by strong predictions for the more easily found domain in the full-length protein.
Failure to conserve an active-site residue could mean several things:
- the residue is not in an otherwise conserved region, and the sequence-based aligners could not figure out that the residue alignment was important.
- the residues really are not in the same place relative to the rest of the fold.
- the function is different.
We have done some tests of SAM-T99 (which is very similar to SAM-T02 for constructing multiple alignments) as a multiple aligner (using theBAliBase test suite), and found that the alignments produced by SAM-T99 are about as good at those produced by CLUSTAL. You can try realigning them with other multiple aligners (such as CLUSTAL, PRRP, or DIALIGN), but it is probably a good idea to thin the alignment to a few diverse sequences first, since those aligners get very slow when given many sequences. If the alignment changes dramatically, then there is good reason to suspect the alignment.
Currently, the best multiple alignment method we know of is Muscle at http://www.drive5.com/muscle. It, however, does global alignments, which can cause severe over-alignment, especially wiht multidomain proteins.
We have not yet had much success with our attempts to score HMMs against HMMs, though we have not, of course, tried all possible algorithms.
Our best method so far is to combine the results of scoring all template sequences against a target HMM and the target sequence against all template HMMs. There is probably a better method, and some people have had success with profile-profile alignment, but (so far) it has not worked well in our hands.
Yes, we encourage you to download a copy of the SAM software. It's available free for academic use at the SAM web site. You may find additional functionality you need with the full SAM package that is not currently accessible through our web site.
SAM-T99 and SAM-T02 have not been optimized for transmembrane predictions. They are "ok" on transmembrane predictions, but not nearly as good as tools optimized for that task. We've been told that the TMHMM server is currently the best predictor for transmembrane helices, but we've not done any tests ourselves.
The probabilities returned by the SAM-T06 server are from neural nets.
The neural nets were trained to maximize
sum_examples log Phat(correct letter | example)
where Phat is the neural net output of predicted probability for a letter.
The calibration has been checked and is pretty good. That is, in the cases where the neural net has said that the probability of helix is 0.80 about 80% of the time there really is a helix there. The cost function used in training makes the calibration very tight on the training set.
Of course, the neural net is using a multiple alignment as an input, so if the target sequence is misaligned or has a different structure from the sequences it is aligned to, the neural net can produce a confident, but incorrect, secondary structure prediction.